A wake-up call for NPS: how economic downturn is uncovering commercial issues with old-school analytics

Uncrowd spoke to a senior board member of a UK retailer recently. She was worried. Her customer satisfaction scores had collapsed during lockdown, so as things opened up in 2021, she had thrown everything at moving that needle up again. Anything vaguely related to customer experience got money spent on it. And it worked.
Now, as the market shrinks, along with her CX budget, she is being asked to repeat the stuff that worked from last time.
But she doesn't know what worked. Her Net Promoter Score (NPS), the main CX metric available to her, is not changing. She can’t tell which bits of that big CX spend produced results. She could do half of what she did before and none of it might work. Or she could do half and all of it might work. Any investment she makes from her shrinking budget is a shot in the dark
Another senior team member at a major retailer told us, “Revenue is falling back. The number of customers participating in the market is falling back. But my NPS hasn't changed. What can I do with that?"
A global commercial director told us, “My NPS is very high. The market has now changed, customers are reducing spending and my scores are still just as high. I wasn't convinced by them before, now I know they're meaningless.”
In every conversation we have with retailers and brands right now, we hear the same thing. Their revenues are falling and their NPS isn't changing. “What do we do?”
There is a problem with NPS. A big problem. Some people have raising concerns for a long time, but while markets were growing and times were good, retailers didn’t have any reason to worry. Their NPS was healthy, their sales were going up. The two things appeared correlated.
But right now, the economic downturn is showing the limitations of the most widely used customer satisfaction metric. And that problem - that NPS numbers remain constant while shoppers choose to shop elsewhere, or not at all - is a giant, ticking bomb underneath the idea that NPS can tell us anything competitive or useful about customer behaviour.

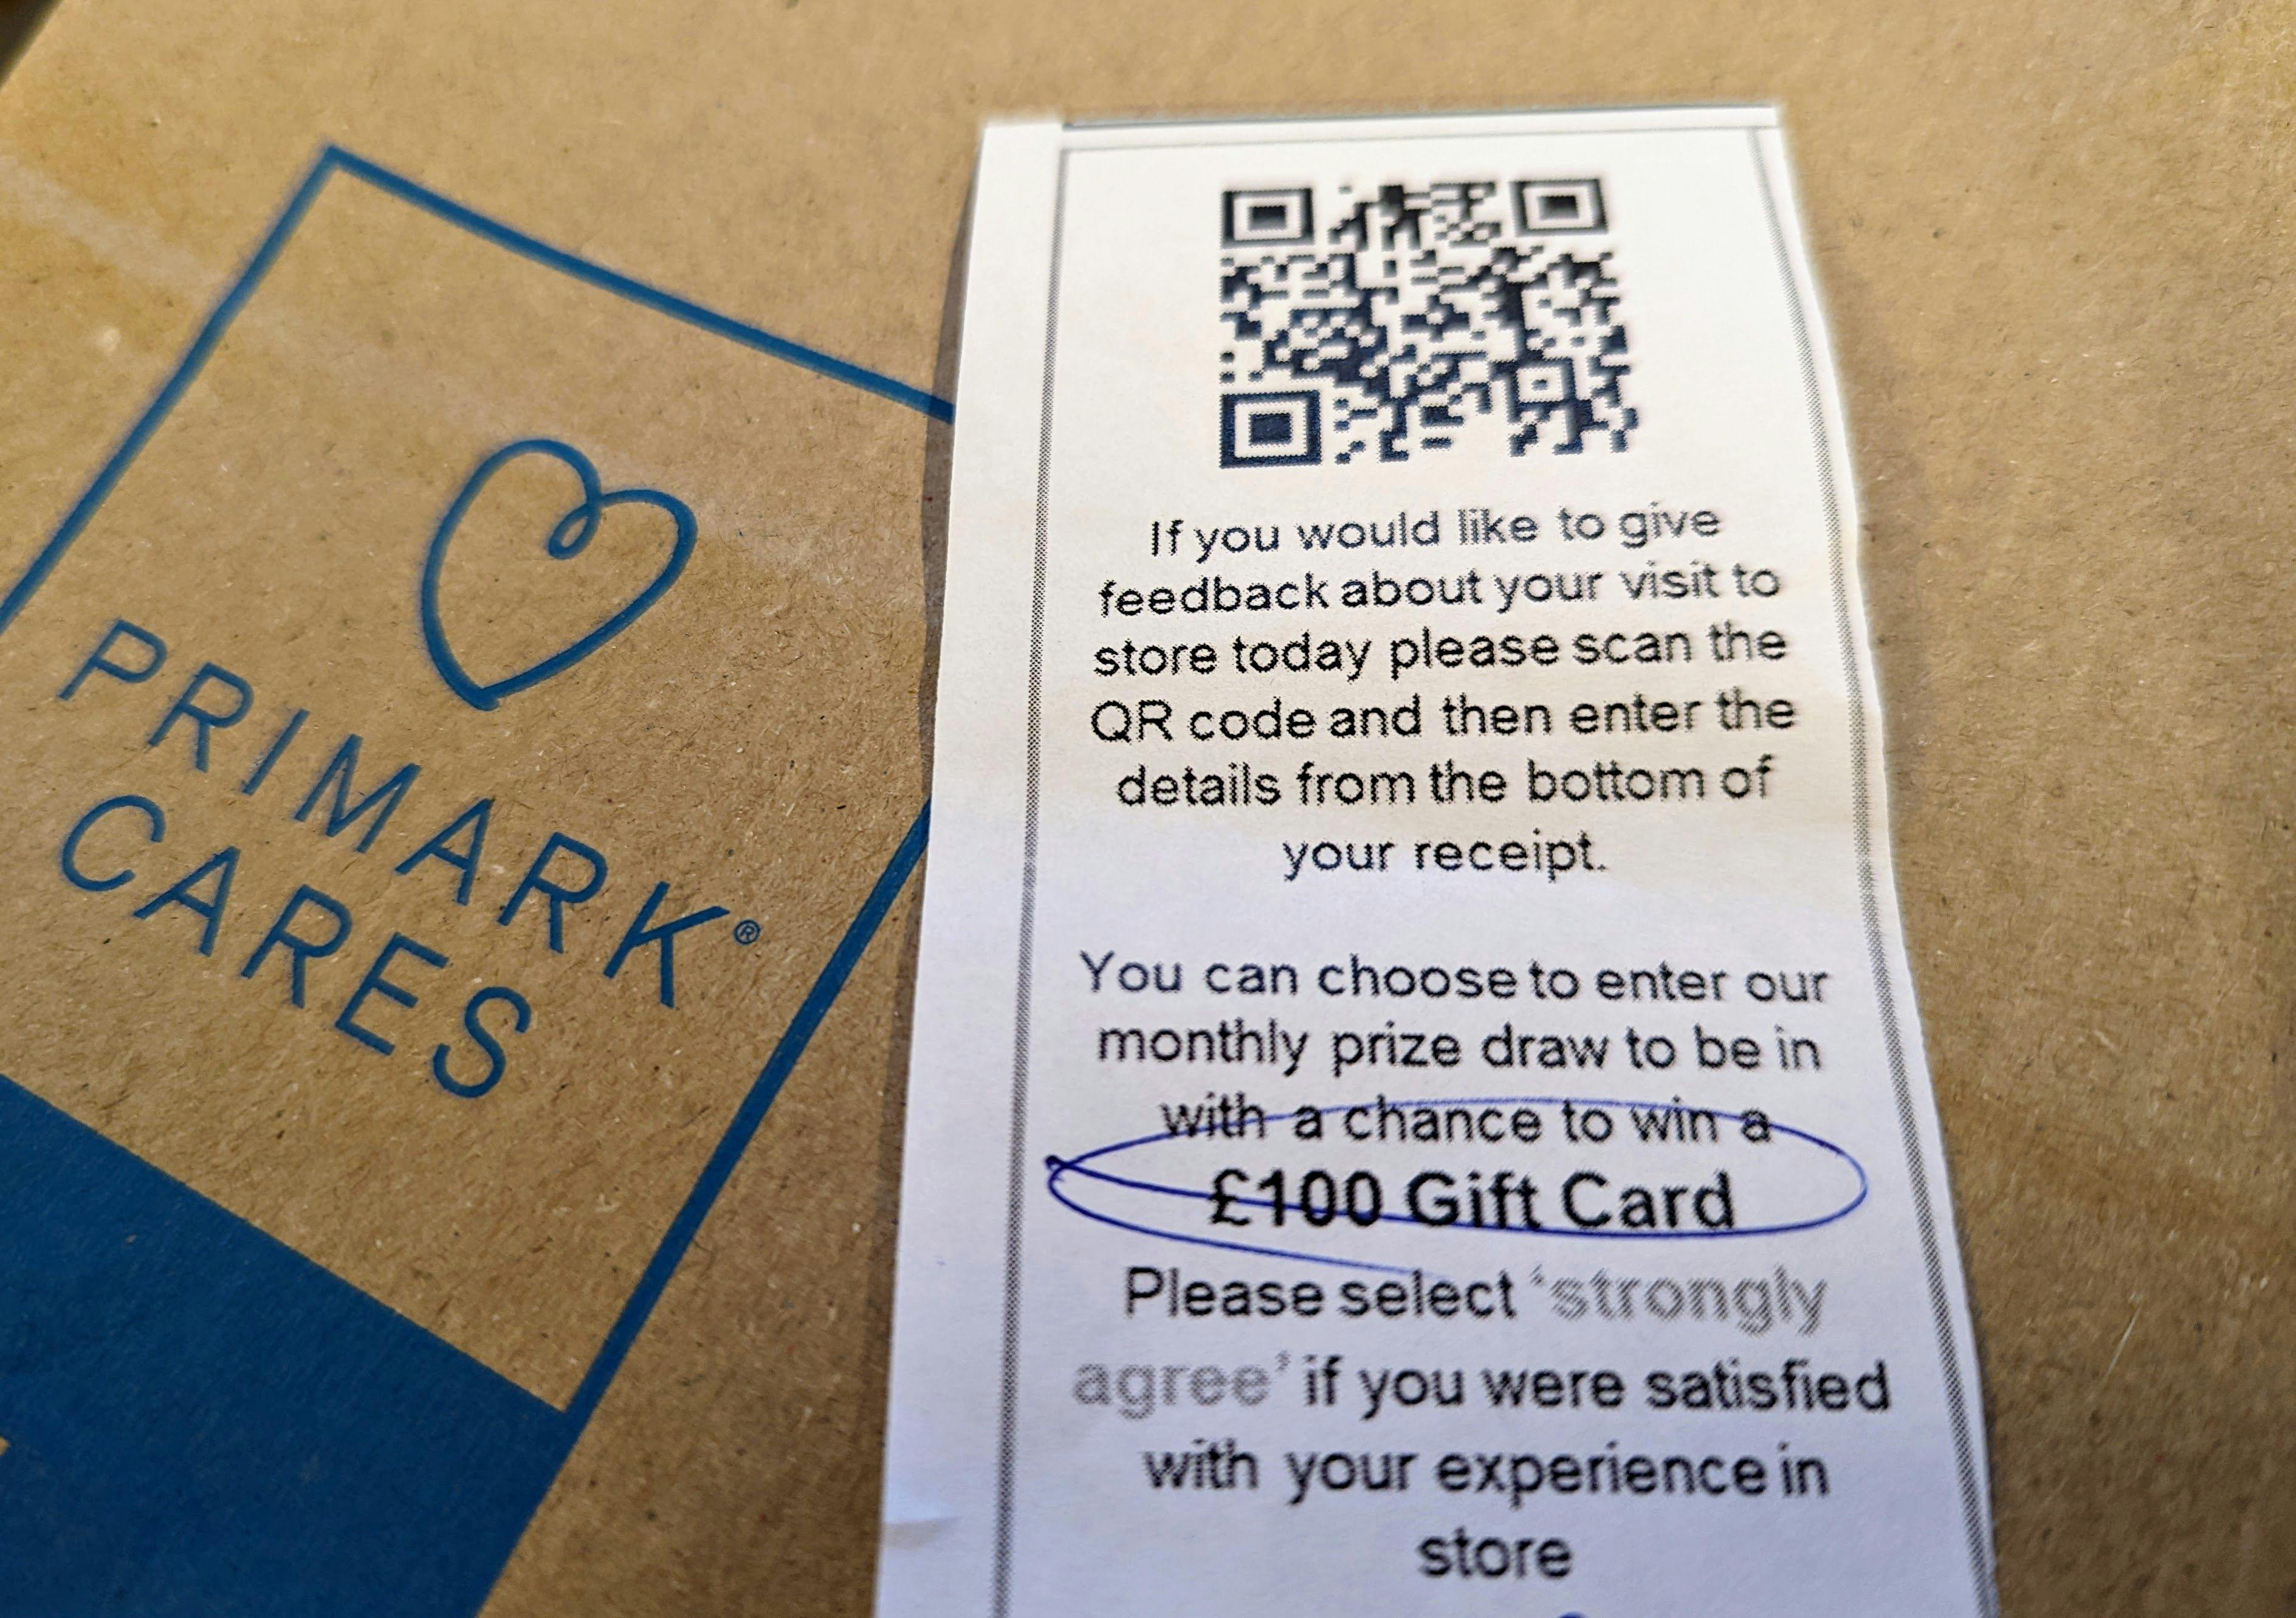
Net Promoter System (NPS), “the one number you need to grow”, was introduced in 2003 by director emeritus of consultancy Bain, Fred Reichheld. Reichheld had seen the limitations of current customer feedback measures – complex, lengthy, expensive surveys that few customers responded to and that produced confusing and quickly out-of-date data. His solution was to sweep away the clutter and replace it with one question, quick and easy to answer, which generated a single-number indication of customer loyalty for a business.
There seemed to be evidence that NPS scores could be correlated with growth. Concentrate on increasing the number of promoters among your customers, and growth will follow. It was an attractive concept with undeniable benefits for businesses (quick, cheap, simple), and NPS swept the world.
NPS has seen some hard times before; the 2008 financial crisis, and the 2020 pandemic. In 2008 NPS was in its infancy. Its inability to provide meaningful insight in a downturn wasn’t robustly investigated. And the pandemic was a unique situation in which lack of correlation in the scores could be put down to exceptional circumstances.
But now we are seeing the first true test of the robustness of NPS. Retailers are weathering a major downturn due to underlying global financial causes. This time, discrepancies in their analytics can’t be written off as teething problems of a new metric, or exceptional circumstances.
And the cracks are beginning to show.
NPS in a shrinking market
When a market is growing, money is constantly entering it. New customers are there for the winning, new spend is on the table for the taking. Businesses have money to invest in improving customer experience. When your NPS goes up, you can confidently say, the figures are up because I'm making my customers more and more satisfied!
When sales are squeezed and your NPS is happily reporting the same great score, what do you do?
But in a recession, people spend less and there’s no new money on the table to be won. If you are to maintain your current revenue or increase your market share, the only option is to physically take spend from other players.
All the while, your NPS? It’s staying the same.
When sales are squeezed and your NPS is happily reporting the same great score, what do you do? Your customers appear to be as satisfied as they were before, just as likely to recommend you to a friend or colleague. But your concrete sales figures show those customers falling away. Where? Why? How do you get them back? How do you use that one score to take the spend that still exists from your rivals?
The limitations of NPS
The deliberately simple structure of NPS was a gamechanger back in 2003. But that structure is now being revealed as a blunt tool, lacking the detail required for effective commercial application.
Lack of actionable detail
When survey data is aggregated for a simple score, it doesn’t deliver the granularity that you need to know what changes to make to attract more customers. Making a robust connection between NPS scoring and commercial application remains highly tentative.
Inward-looking
NPS might give you some insight into your own customers. It might tell you something about what your customers think of your rivals. But it tells you nothing about how your rivals’ customers view them, or you. NPS data is inward-lookingl. If your NPS stays high, but your sales are still dropping, or if your NPS drops as you lose customers elsewhere, you know nothing about what to change to reverse the tide.
Gamification
When customer satisfaction scores are linked to staff bonuses, with financial rewards for high scores and negative consequences for low scores, the system is wide open to gamification. Asking customers to return high scores is a common practice that makes a nonsense of the aim of customer satisfaction metrics like NPS. Even NPS’s inventor, Fred Reichheld, has said “I had no idea how people would mess with the score to bend it, to make it serve their selfish objectives.”
This isn’t the fault of the staff who try to influence the scores. It’s the result of adding a financial consequence to a single number, or worse, of adding a threat of disciplinary action in some form if that number isn’t ideal.
Subjective input
Customers may give different responses to the NPS question in different contexts and mindsets. Each data point reflects a point-in-time reaction, but there is no information in your NPS score about the context of the data – the customer story that generated the score.
Cognitive bias
NPS surveys ask customers to pick one number to rate their experience. But choosing a keystone number triggers system-1 thinking (the fast, automatic mental process that relies on subjective emotion) rather than system-2 thinking (the slower more logical way we solve complex problems). Any conclusions drawn from this data are based on non-rational point-in-time decisions, in other words, risky and unreliable data.
What’s NPS good for?
NPS was born out of an understanding that customer perception feedback wasn’t working. That insight was correct – customer feedback was messy, confusing and hard to act on. NPS was a valiant attempt to cut through the noise and give companies one direct line to listen to customer loyalty.
But the champions of NPS failed to understand the fundamental problem. It wasn’t their choice of customer perception metric that was at fault. It was the process of using flawed and untrustworthy customer perception feedback to guide CX investment.
NPS and other feedback metrics can be used to find and fight fires, uncovering operational problems. NPS can used as a rallying point, an easily communicable number to bully action in a company.
But NPS is not fit for purpose as a CX measuring tool, or a guide for CX investment.
NPS isn’t working, so what’s the answer?
CX is always relative. How well you present your solutions to customers is always relative to how well your rivals are doing the same thing. In an age of choice, customers have the power to choose an alternative easily, so you need to know exactly what that alternative is doing better than you.
This is crucial when a market is shrinking. In times of economic downturn, you need a metric that tells you where the remaining existing spend is going. Who's getting that spend? Who's eating your lunch?
An effective metric should tell you which bits of your CX are succeeding in attracting customers, and which are losing against your rivals. You invest in CX in good times. When times are tight, you need to know which parts of that spend were effective. What do you double down on? What do you cut?
If you have the answers to these questions, you can target those areas and take that money back.
Relative Attractiveness (RA)
Uncrowd’s Relative Attractiveness metric (RA) recognises that the primary driver for growth is how attractive your proposition is to a customer relative to your rivals for a particular customer story – the combination of mission and mindset.
RA doesn’t rely on biased customer perception feedback, instead using impartial ‘quants’ to swarm stores and websites to make thousands of tiny empirical observations across hundreds of CX variables.
The Uncrowd platform processes this data, overlays it with customer stories and identifies gaps versus your competitors and opportunities to reduce CX costs.
Measuring Relative Attractiveness with Uncrowd’s platform tells you which of your CX spends are effective, where you’re losing out to competitors, and what to do to steal back that lunch in a shrinking market.

RA can be managed and increased by answering five questions:
- What is our RA and is it trending in the right direction?
- According to RA across the customer journey, where are we winning?
- Where are we losing?
- Where along the journey do customers drop out?
- What are the jobs to be done to reduce purchase friction and increase buyer reward in the places identified in 2, 3 and 4 above?
Uncrowd is on a mission to improve every customer experience on the planet and we're doing that through a unique combination of CX observation, quantitive measurement and comparative results. Our data is objective, empirical, and always shows your next best action.